Nothing’s in this popup window yet because you haven’t clicked on any buttons. Try clicking on those “?” buttons and some text should show up.
| ← Back to instructions | The U.S. News ranking formula in... 20XX |
Basic viewAdvanced view |
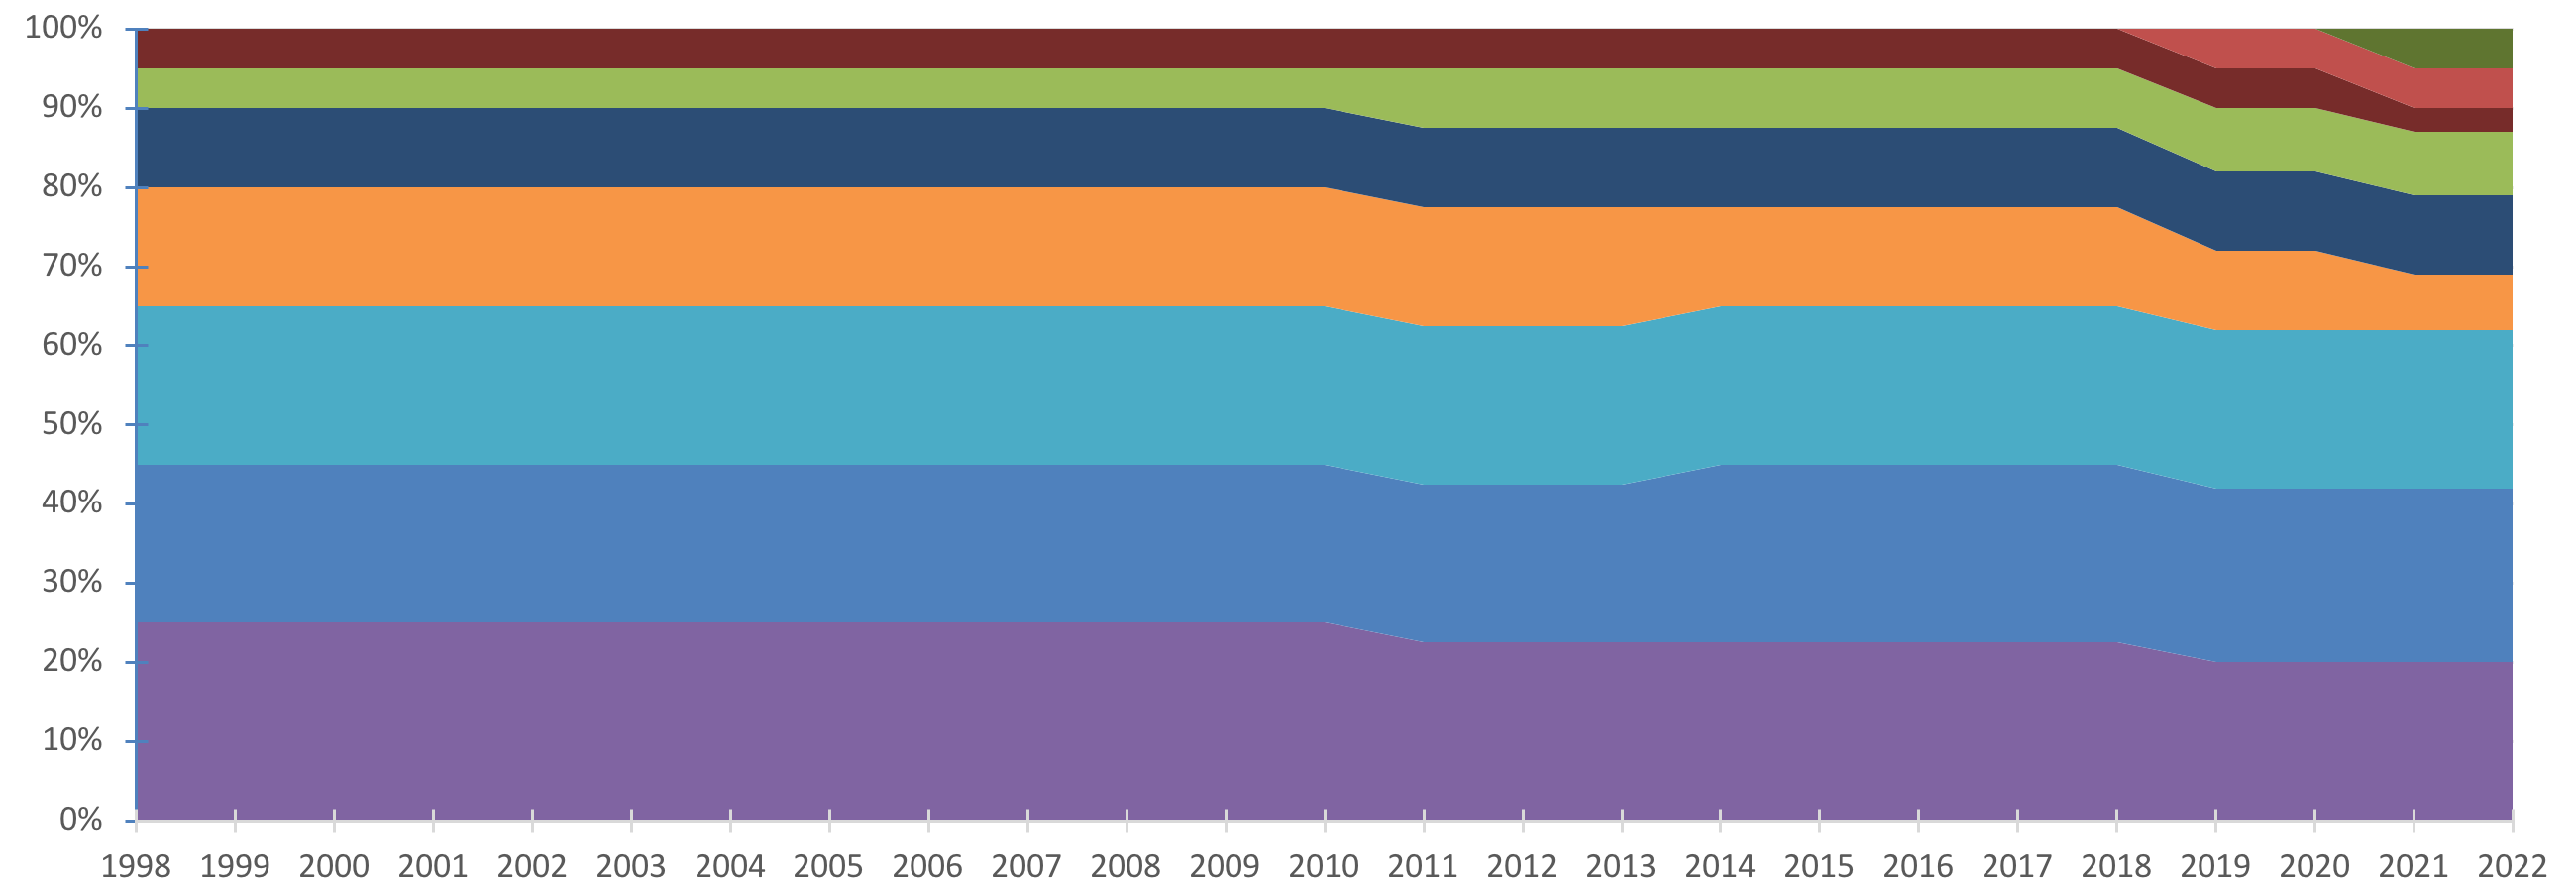
KeyThe U.S. News formula currently consists of 9 factors. █ Graduate debt █ Social mobility █ Alumni giving █ Grad. rate performance █ Financial resources █ Selectivity █ Faculty resources █ Retention █ Reputation |
|
|
| ← −1 year |
Student Debt Added to the Formula, While Selectivity Continues to Be DeemphasizedJust two years after adding the social mobility factor, U.S. News added another brand-new factor measuring graduate indebtedness. The factor aims to reward colleges that leave their graduates with less student debt. College affordability had previously been identified as an omission from the rankings by, for example, this research paper. In a 180° shift from previous policy, test-blind schools are now allowed to be ranked, but now all schools must report a 6-year graduation rate. The pandemic-era shift away from standardized testing may have driven this change; we’ll see a few more coronavirus-caused changes in next year’s methodology. To make room for the new student debt factor, the weight of alumni giving was reduced from 5% to 3%, and the weight of selectivity was reduced from 10% to 7%. Both remaining selectivity subfactors (test scores and class rank) continue to decline in relevance in today’s college application landscape, but they remain in the formula. Keep in mind that selectivity was once weighted at 15%. There are a couple of the usual minor tweaks as well. Graduation rate performance is now based on a 2-year average, continuing the trend of smoothing out the data used for the rankings. On the other hand, in faculty resources, salary is now based on “full-time faculty salaries” over 1 year rather than 2-year average of “both salaries and nonsalary compensation.” U.S. News Dumps High School Counselor Survey but Can’t Quit Class RankAfter 9 years, high school counselor reputation surveys have been discontinued. U.S. News says they did this because they “had greater confidence in the data and the significantly increased response rates from the peer assessment surveys”. Look at the downward trend in response rates on the high school survey (in my 2019 write-up) and you’ll understand why they dumped it. The peer assessment survey now accounts for all 20% of this category’s overall weight. A change made to the selectivity factor revealed how unreliable class rank data has become for measuring selectivity. If class rank is available for <10% of students at a school, the school gets an estimate instead of a penalty. (It’s unclear how they calculate this estimate.) However, schools still get a penalty if the data is available for 10–20% of students; this may be because some schools don’t report class rank data for any of their students, which puts them in the <10% category. Also, schools get a footnote in the ranking table if class rank is available for <20% of students (was <50%). Before this change, 79% of schools in the top 50 had a footnote about their class rank data; after this change, only 8% of top-50 schools had a footnote. This means most of the top-ranked schools have class rank data for <50% of their students. So why is that subfactor still part of the formula? The prediction formula for graduation rate performance now includes the percentage of students who are first-generation students and uses a “multiyear average instead of a single cohort” for calculating the percentage of students on Pell grants. U.S. News also made some changes to where they got their data from. They switched to “open-source data from the Bureau of Economic Analysis” for salary data in the faculty resources category. This data is presumably more reliable than what the colleges were previously feeding to U.S. News. In addition, substitute data from the Department of Education’s Integrated Postsecondary Education Data System was used if schools do not report data in some areas. This suggests some schools were not self-reporting data (or reporting inaccurate data) in these areas. Negative Media Coverage Drives Major Formula ChangesFor the 2019 ranking, U.S. News made the most significant formula changes they’d made in a while — perhaps since they moved away from the all-survey model 30 years before. This is interesting timing to say the least, given that the year before, Politico and The Washington Post both released articles criticizing many aspects of the ranking methodology. For the first time since 1997 (when graduation rate performance was added), a completely new factor was added to the formula: social mobility. This was almost certainly created in response to the above accusations that the rankings “promote economic inequality”. Click the ? button in the Key to learn more about it and its subfactors. Some of the existing categories have been given new names on the “what’s new” page (click the “2019” link to read that page). Some of these names (“Student Excellence” for “Selectivity”; “Expert Opinion” for “Reputation”) give off the impression that U.S. News is trying to “sell” the usefulness of these factors to readers. Both of these factors were changed in 2019 to remove or reduce controversial subfactors. For selectivity (oh, sorry, “Student Excellence”), acceptance rate was removed as a subfactor, though U.S. News still publishes a separate ranking of the schools with the lowest acceptance rates. Only 35.5% of college administrators responded to the reputation survey (down about 5% from the year before). The Washington Post’s 2017 article said that many administrators have admitted they “don’t fill out the forms themselves because they don’t really have a deep understanding of other schools’ programs... [a]nd they doubt that many of those who do complete the survey possess a deep understanding”. “Expert Opinion”? Give me a break. And then there’s the high school counselor survey, which in its 9th year is looking like a failed experiment, as the weight of the survey was lowered from 7.5% to 5% overall. (The survey of college administrators remained weighted at 15%.) What’s more, unlike in previous years, U.S. News did not publish the response rate for the high school counselor survey. Given that only 7% of counselors responded the year before, there’s a good chance U.S. News didn’t publish this information because they were embarrassed about how low the response rate was. Yawn...The only changes made this year were subtle, behind-the-scenes ones. Specifically, the graduation rate performance prediction formula now accounts for what percentage of degrees granted are STEM degrees (because STEM students graduate at lower rates). Additionally, U.S. News verified graduation rate data (part of the retention factor) using the government-run National Center for Educational Statistics instead of the NCAA. Yeah, it's not very exciting. Class Size Gets More ComplicatedClass size still counts for 40% of the faculty resources score (8% of the overall score) but more gradations of “credit” (in descending order: <20; 20–29; 30–39; 40–49; and ≥50 gets no credit). This may reduce the advantage gained if a school tries to game the system like Clemson did in 2009. Clemson, and presumably other schools, tried to improve their class size score by reducing a class with, say, 22 students down to 19, while allowing large classes to get even larger. Every year, U.S. News publishes the response rates for their reputation surveys, allowing us to see how much these rates have declined over the years. In 2017, 39% of college administrators filled out the peer assessment survey (down from 65% in 1997), and 7% of high school counselors filled out their survey (down from 21% in 2011). This reflects the declining popularity of the rankings among people with ties to higher education. Test-Optional Schools Get Penalized, in a Decision That’s Sure to Age WellThe percentage weights did not change. However, “2 small changes” were made to reputation: peer assessment ratings are now based on the last 2 years, and high school counselor ratings are now based on the last 3 years. In both cases, an additional year has been added to the average. And in a move that seems surprising now, if less than 75% of applicants submitted test scores, a 15% penalty is applied to the school’s test scores. This has the potential to punish test-optional schools, though they changed it once the pandemic prompted many top-ranked schools to go test-optional. This is the first ranking where they mentioned that they do this, but they say they did it last year as well. No Shirt, No Shoes, No Service, No ChangesNo changes were made to the methodology. The Slow Decline of Class RankClass rank is deemphasized in the selectivity calculation because “as each year passes, the proportion of high school graduates with class rank on their transcripts is falling,” making the data they have less representative. This coincides with selectivity’s weight being reduced from 15% to 12.5% (with retention gaining 2.5% as a result). My Friend Made a Tiny Change to the U.S. News Rankings and All I Got Was This Lousy T-Shirt!In 2013, the methodology only got “one small methodology change” to the reputation factor: the high school counselor reputation ratings are now averaged from the last 2 years, rather than being based on 1 year. “Strategic Voting” and For-Profit CollegesThe percentage weights did not change. However, U.S. News did make a couple other methodology changes. On the reputation survey, the 2 highest and 2 lowest scores are now removed for each school “[i]n order to reduce the impact of strategic voting by respondents.” This may be a response to the “strategic voting” by Clemson and other schools. The article also discusses how Clemson manipulated their class sizes to boost their ranking; U.S. News made a change to that part of the formula in 2017. In addition, accredited for-profit colleges that give bachelor’s degrees are now ranked. Shoutout to the University of Phoenix, which as of the 2022 ranking is in the bottom 25%, so it doesn’t get an official ranking, but it ranks last in almost every category in the latest ranking, so it would clearly be last if it did get a number. High School Counselor Survey Added to Last Ranking Published in Print MagazineHigh school counselors are now given their own reputation survey, which counts for one-third of the reputation score (7.5% of the overall score). U.S. News also took this opportunity to lower the factor's weight from 25% to 22.5%, which makes the overall weight of the existing college administrator survey 15%. The high school counselor survey uses the same methodology as the existing college administrator survey (i.e. rate each of these colleges on a scale from 1 to 5). U.S. News claims that high school counselors have been asking to be included for a long time. Meanwhile, the weight of graduation rate performance was increased (from 5% to 7.5%), because according to the magazine, it’s “well received by many higher education researchers.” (Does that mean their other metrics aren’t well-received by researchers?) In previous years, the bottom half of colleges in the ranking were listed alphabetically instead of hierarchically. Starting in 2011, the top 75% get numerical ranks, leaving the remaining 25% alphabetized. U.S. News says this expansion of the rankings was by popular demand, but it raises the question of how accurate/distinguishable the rankings of these third-quartile schools really are. And this isn’t something I would normally include because it isn’t about the ratings per se, but this was the last ranking before U.S. News ceased publishing its print magazine (though they continue to publish a print edition of their college rankings). They started out as a national news-magazine à la Time or Newsweek, but looking at their website today, you can see they’ve become a shell of their former self. All of their top 5 most popular articles (as of writing) are repackaged articles from Reuters and the Associated Press. Their homepage is packed with stock-market listicles. Original news reporting is present on the homepage, but many prominently-featured articles in this category are days old. There is, however, one part of their business that continues to expand: their rankings. Test Score TweaksThe percentage weights did not change. The only notable change to the ranking was in selectivity, where the test scores calculation now includes both SAT and ACT scores (instead whichever one was submitted by more students). Outside of the main ranking, U.S. News mentioned their “Up-and-Coming Schools” ranking, created “in response to criticism that [their] academic peer assessment survey is too slow to pick up improvements at colleges.” (This is the second year they published this ranking, though they did not mention it in their 2009 methodology.) They don’t even consider removing the peer assessment survey from the main ranking formula. |
→ +1 year |
 buttons to learn more about each factor and any subfactors that may go into it.